Overview
The main purpose of this application is to create online maps, displaying the world or a specific country or area, coloring regions or adding markers that can be interactive.
You will be able to show hundreds of different kinds of maps online, including:
- A map of the entire world.
- A continent or a sub-continent (Africa, Europe, Americas, Asia, Oceania and all their sub-continents).
- A country (including the most requested: USA , United Kingdom, Canada, France, Germany, Spain, Italy, Brazil, India, Australia… virtually all the countries in the world already included!)
- A country divided by its regions.
- A state in the United States.
- The United Stated divided by metropolitan areas.
- A state in the United States divided by metropolitan areas.
You can add active colored regions to the map, and display them in 2 different ways:
- As Regions - It will color the whole region, for example a country, a country province, or a US state.
- As Markers -It will display a colored bubble in the chosen regions, that can be a city, a state or a country.
You can add interactivity to the active regions:
- A Tooltip - A tooltip will be displayed by default on hover with the information you provide.
- An Action – You can set up diferent kinds of action for when the user clicks in an active area. You can make a new URL open, or simply display a message. Advanced users will be able to create their own Javascript functions for customized actions.
You will be able to customize the visual of your maps:
- Background color;
- Border width and color;
- Inactive regions color;
- Individual colors for each active region;
- Markers size;
- Width and Height of the map;
General Instructions
This is the screen you will find in the Generator page.
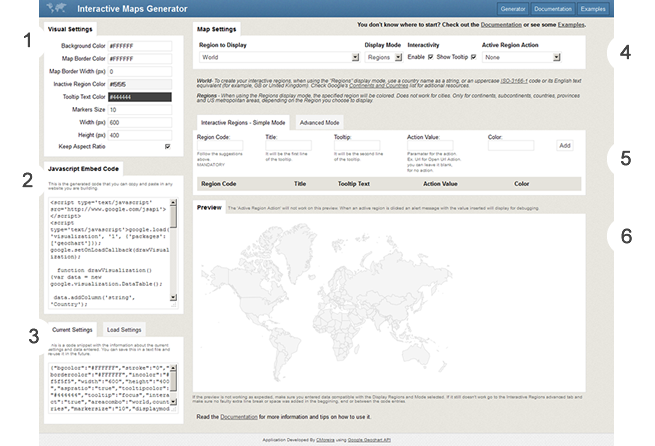
01 VISUAL SETTINGS
Background Color: The background color for the main area of the chart. Can be either a simple HTML color string, for example: 'red' or '#00cc00'. Tip: you can set it to transparent so it doesen't have any solid background color;
Map Border Color: The color of the map border, as an HTML color string.
Map Border Width: The border width, in pixels. Tip: you can set it to 0 to display no border.
Inactive Region Color: Colors to assign to regions with no associated data. Tip: you can set it to transparent so it doesen't have any solid background color;
Tooltip Text Color: Color string in HTML for the tooltip text.
Marker Size (px): Number in pixels for the size of the bubbles, when the Markers display mode is chosen.
Width (px): Width of the visualization, in pixels. Will be the default, unless the height option is specified and keepAspectRatio is set to true - in which case the width is calculated accordingly.
Height (px): Height of the visualization, in pixels. Will be the default, unless the width option is specified and keepAspectRatio is set to true - in which case the height is calculated accordingly.
Keep Aspect Ratio: If true, the map will be drawn at the largest size that can fit inside the chart area at its natural aspect ratio. If false, the map will be stretched to the exact size of the chart as specified by the width and height options.
02 - JAVASCRIPT EMBED CODE
This is the code you'll need to copy and place on the webpage you want the map to appear. The code is composed by a javascript block of code and a html div. You can place this code in any webpage document that you can edit. This could be your own html files, a blogger template, a tumblr template, or other similar platform templates that you can edit the code.
For the best performance across all browsers we suggest you position the javascript code block (starting in <script ... and finishing at </script>) just before the closing </head> tag of your file, and the div code on the area of your website where you want the map to display.
03 - CURRENT SETTINGS / LOAD SETTINGS
The tab 'Current Settings' displays a code block that you can copy and save for future use. It holds the information about the current settings of the map you are creating. This code can then be loaded in the 'Load Settings' tab. If you are building an advanced map it is advised that you save this settings, so you can use them later, in case you need to generate a new version of that map.
04 - MAP SETTINGS
Region to Show: The area to display on the map. (Surrounding areas will be displayed as well.) Can be one of the following:
- 'world' - A map of the entire world.
- A continent or a sub-continent.
- A country.
- A state in the United States.
This default setting works only to have one of these options selected by default when you are creating a new map. It will not prevail over a different option you might have chosen when creating a map, even if you choose to display the default visual settings.
Display Mode: Which type of map you want to display. The data entered for areas to activate must match the value specified. The following values are supported:
- 'Regions' - This is a region map. It is the best option when you want to make a whole continent, country, province or US metropolitan area interactive.
- 'Markers (Text Location)' - This is a marker map. Best option to give interactivity to a city. It will create a colored bubble on the area specified. You can insert the location where you want the markers to appear as a text string. It will be a little bit slow loading the markers, if there are a lot of them, because they need to be converted to coordinates by the google api.
- 'Markers (Coordinates)' - This is the same as the option before, but the input should be a coordinates value. It is much faster. This is the recomemded option if you're creating a map with more than 10 markers.
05 - INTERACTIVE REGION VALUES
This is where you will insert the data to display. You can insert it one by one, or use the advanced interface to include a CSV text with the data. Follow the instructions displayed when doing so.
Data you will need to insert:
Region Code: This is the only mandatory field. Depending on your display mode and region to display, the Region Code needed will be different. Information on which codes or data to insert will display according to your choices.
Title: It will be the line of the tooltip. You can use the name of the Region for example. This was added, to ensure the value is human readable when you have to use ISO codes.
Tooltip: Second line of the tooltip. Complementary Information. Not mandatory.
Action Value: If you chose an action this is the field where you will have to put the value associated with it. For example, if you chose the 'Open URL' action, you will need to insert here the URL you want to open. If you choose 'Alert Message', you should insert the message here.
Color: color for the active region.
06 - THE PREVIEW
The Default Settings Page also has a preview map, so you can have an idea on how your maps will look like when using the default settings.
Requirements
This plugin uses the Google Geochart API that creates the SVG maps that this plugin displays, therefore you need to be connected to the internet for this application to work.
It works better in the most recent browsers, specially Firefox 3 and above and Chrome.
Your browser needs to have javascript enabled.
Advanced Customization
When creating a map, you have a lot of customization options on the administration panel, including: background color, border color and width, inactive regions color, markers size and color and the active regions color. This are the options that the Google Geochart API has by default. However, advanced users will be able to extend this customization features.
If you have some knowledge of CSS, you will be able to customize the maps even further, creating css rules for the maps you created.
You will have to place this CSS rules on your CSS file, or embed them on the post or page where your map will show.
Country borders color and mouse cursor
#visualization path {
stroke-width:1; /* control the countries borders width */
stroke:#6699cc; /* choose a color for the border */
cursor:pointer; /* display the pointer when the map hovers the map. */
}
Hover effect
The hover effect is created with a class and an advanced selector that creates a rule to fill with the color red the regions that are colored #f5f5f5, the color that was chosen for the inactive regions.
#visualization path:not([fill^="#f5f5f5"]):hover {
fill:red;
}
FAQ
Can I display multiple maps per page?
Yes you can. However, you will have to change the last two values that say 'visualization' in the embed code, and give it unique values for each map you want to include.
Do I have to include or upload any extra files to my website so the maps work?
No. You don’t have to upload any maps or extra files, just place the embeb code. You just need to choose what area to display from a dropdown menu. The code loads the maps with the Google Geochart API that includes maps of all the world.
How do maps display and function in a responsive website?
The maps are partially responsive. If no width is specified it will load with the maximum width available in the container div. For example, it will load and adapt with different sizes for phones/ipads/laptops. However, after loaded it will not change size if you resize the window.